GW PSC Workshop · October 6, 2026
CS 101 for Political Scientists
Alperen Keles
Today
- What happens when you render a
.qmd/.rmdinto a PDF? - How do you coordinate edits and maintain long-term projects?
- Pitfalls and leverage points of using AI in research
Representation
Computer science is about representation and expressivity
| Base | Representation |
|---|---|
| 10 (decimal) | 1776 |
| 2 (binary) | 11011110000 |
| 8 (octal) | 3360 |
| 16 (hexadecimal) | 6F0 |
From numbers to letters: ASCII
Agree on a table: every character gets a number.
| Character | Decimal | Hex | Binary |
|---|---|---|---|
V | 86 | 56 | 01010110 |
O | 79 | 4F | 01001111 |
T | 84 | 54 | 01010100 |
E | 69 | 45 | 01000101 |
Unicode & UTF-8
| Character | Code point | UTF-8 bytes |
|---|---|---|
A | U+0041 | 41 |
ç | U+00E7 | C3 A7 |
ş | U+015F | C5 9F |
中 | U+4E2D | E4 B8 AD |
| 🗳️ | U+1F5F3 | F0 9F 97 B3 |
150,000+ characters, 1–4 bytes each. Plain ASCII text is already valid UTF-8.
One document, many representations
Timing and Turnout in Off-Cycle Governor Elections
1 Introduction
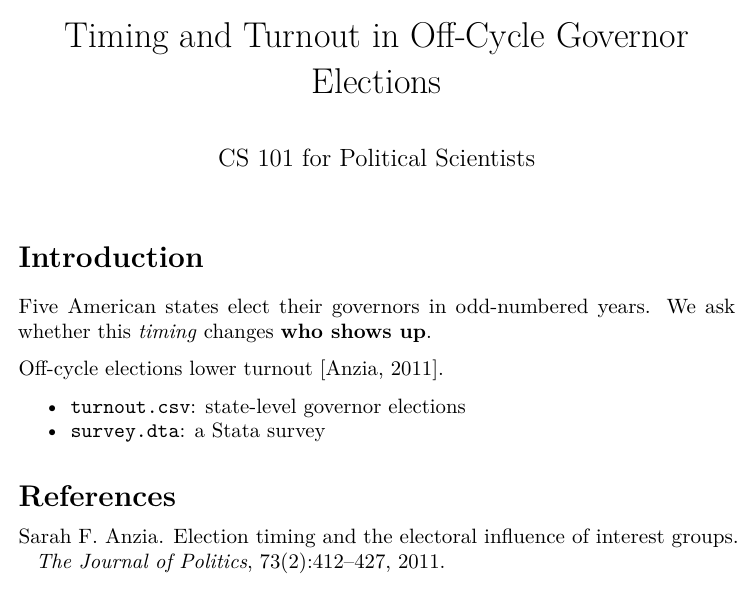
Five American states elect their governors in odd-numbered years. We ask whether this timing changes who shows up.
Off-cycle elections lower turnout (Anzia 2011).
turnout.csv: state-level governor electionssurvey.dta: a Stata survey
---
title: "Timing and Turnout in Off-Cycle Governor Elections"
author: "CS 101 for Political Scientists"
---

# Introduction

Five American states elect their governors in
odd-numbered years. We ask whether this *timing*
changes **who shows up**.

Off-cycle elections lower turnout [@anzia2011election].

- `turnout.csv`: state-level governor elections
- `survey.dta`: a Stata survey
\title{Timing and Turnout in Off-Cycle Governor Elections}
\author{CS 101 for Political Scientists}
\begin{document}
\maketitle

\section{Introduction}
Five American states elect their governors in
odd-numbered years. We ask whether this \emph{timing}
changes \textbf{who shows up}.

Off-cycle elections lower turnout \citep{anzia2011election}.

\begin{itemize}
  \item \texttt{turnout.csv}: state-level governor elections
  \item \texttt{survey.dta}: a Stata survey
\end{itemize}
Part 1
From .qmd to PDF
Editing in a WYSIWYG editor
Editing in LaTeX
Textual vs. Binary Formats
Textual
Binary
turnout-paper/data/turnout.csv
"abbr","year","turnout_pct"
"VA",2015,30.6
"VA",2019,38.8
"VA",2023,33
"NJ",2015,42.5
"NJ",2019,24.8
"NJ",2023,28.9
"KY",2015,39.6
"KY",2019,44.8
"KY",2023,41.6
- The first line is the header: column names.
- Every other line is one row (here: one election).
- , separates the columns. That's the whole format.
turnout-paper/data/states.tsv
state	abbr	region	gov_timing
Virginia	VA	South	off-cycle
New Jersey	NJ	Northeast	off-cycle
Kentucky	KY	South	off-cycle
Louisiana	LA	South	off-cycle
Mississippi	MS	South	off-cycle
Ohio	OH	Midwest	on-cycle
Pennsylvania	PA	Northeast	on-cycle
Georgia	GA	South	on-cycle
- Same idea as CSV, but columns are separated by an invisible tab character (shown here as ⇥).
- Handy when values themselves contain commas.
turnout-paper/notes.txt
TODO
- ask advisor whether to add 2025 VA/NJ races
- the turnout numbers in data/ are SIMULATED for teaching, swap in real data later
- coauthor uses Stata -> analysis/models.do mirrors analysis/clean.R
- No structure at all: just characters and line breaks.
- Any program can read it, which is exactly why it lasts.
turnout-paper/paper.rmd
---
title: "Timing and Turnout in Off-Cycle Governor Elections"
author: "CS 101 for Political Scientists (demo paper)"
date: "October 6, 2026"
bibliography: references.bib
biblio-style: plainnat
header-includes:
  - \usepackage{booktabs}
  - \usepackage{multicol}
output:
  pdf_document:
    citation_package: natbib
---

```{r setup, include=FALSE}
knitr::opts_chunk$set(echo = FALSE, message = FALSE, warning = FALSE, dpi = 200)
source("analysis/clean.R")
```

# Introduction

Five American states elect their governors in odd-numbered years, away from
federal elections. We ask whether this *timing* changes **who shows up to vote**.

Political scientists have long argued that off-cycle elections lower turnout and
hand more influence to organized groups [@anzia2011election; @anzia2014timing].
When citizens are unhappy with their government they can exit or they can use
their voice [@hirschman1970exit], and voting is the most common form of voice.^[All
data in this paper are simulated for teaching purposes.]
- YAML header between
---lines: title, author, output settings. - R chunks in
```{r}fences; knitr runs them. - Everything else is Markdown, with [@citations].
the same paper written for Quarto (illustrative)
---
title: "Timing and Turnout in Off-Cycle Governor Elections"
format: pdf
bibliography: references.bib
---

```{r}
#| label: setup
#| include: false
source("analysis/clean.R")
```

# Introduction

Five American states elect their governors in odd-numbered years, away from
federal elections. We ask whether this *timing* changes **who shows up to vote**.
- Quarto is R Markdown's successor: same three parts (YAML, chunks, Markdown).
- Chunk options move inside the chunk as #| comments.
format: pdfinstead ofoutput: pdf_document.
turnout-paper/build/2-paper.tex (generated by pandoc)
% Options for packages loaded elsewhere
\PassOptionsToPackage{unicode}{hyperref}
\PassOptionsToPackage{hyphens}{url}
%
\documentclass[
]{article}
…
\begin{document}
\maketitle

\hypertarget{introduction}{%
\section{Introduction}\label{introduction}}

Five American states elect their governors in odd-numbered years, away
from federal elections. We ask whether this \emph{timing} changes
\textbf{who shows up to vote}.

Political scientists have long argued that off-cycle elections lower
turnout and hand more influence to organized groups
- Preamble (before
\begin{document}): document class and packages. - Body: text plus \commands like
\section{…}and\emph{…}. \begin{x} … \end{x}environments nest, like boxes in boxes.
turnout-paper/references.bib
@book{hirschman1970exit,
  title     = {Exit, Voice, and Loyalty: Responses to Decline in Firms,
               Organizations, and States},
  author    = {Hirschman, Albert O.},
  year      = {1970},
  publisher = {Harvard University Press},
  address   = {Cambridge, MA}
}

@book{anzia2014timing,
  title     = {Timing and Turnout: How Off-Cycle Elections Favor Organized Groups},
  author    = {Anzia, Sarah F.},
  year      = {2014},
  publisher = {University of Chicago Press},
  address   = {Chicago}
}
- One entry per source: @type{key, then field = {value}.
- You cite by key:
[@hirschman1970exit]or\citep{hirschman1970exit}. - Zotero, Mendeley and Google Scholar all export it.
turnout-paper/analysis/clean.R
# Reads the three datasets and builds the objects paper.rmd uses.
# Paths are relative to the project folder (where paper.rmd lives).

library(dplyr)

states  <- read.delim("data/states.tsv")         # tab separated
turnout <- read.csv("data/turnout.csv")          # comma separated
survey  <- haven::read_dta("data/survey.dta")    # Stata, binary

elections <- turnout |>
  left_join(states, by = "abbr") |>
  mutate(off_cycle = gov_timing == "off-cycle")

by_timing <- elections |>
  group_by(gov_timing) |>
  summarise(states = n_distinct(abbr),
- A program: statements run top to bottom.
- <- stores a result in a name; # comments are for humans.
turnout-paper/analysis/models.do
* The same comparison as analysis/clean.R, for a coauthor who uses Stata.
* Run from the turnout-paper folder:  do analysis/models.do

import delimited "data/states.tsv", delimiter(tab) clear
tempfile states
save `states'

import delimited "data/turnout.csv", clear
merge m:1 abbr using `states', nogenerate

generate off_cycle = gov_timing == "off-cycle"
encode region, generate(region_code)
tabstat turnout_pct, by(gov_timing) statistics(mean sd n)
regress turnout_pct off_cycle i.region_code
- Also a program: one Stata command per line.
- The same analysis as
clean.R, so a Stata-using coauthor can run it.
turnout-paper/build/paper.html (generated by pandoc)
<body>
<header id="title-block-header">
<h1 class="title">Timing and Turnout in Off-Cycle Governor
Elections</h1>
<p class="author">CS 101 for Political Scientists (demo paper)</p>
<p class="date">October 6, 2026</p>
</header>
<h1 id="introduction">Introduction</h1>
<p>Five American states elect their governors in odd-numbered years,
away from federal elections. We ask whether this <em>timing</em> changes
<strong>who shows up to vote</strong>.</p>
<p>Political scientists have long argued that off-cycle elections lower
turnout and hand more influence to organized groups <span
class="citation" data-cites="anzia2011election anzia2014timing">(Anzia
2011, 2014)</span>. When citizens are unhappy with their government they
can exit or they can use their voice <span class="citation"
- <tags> wrap content:
<h1>…</h1>,<p>…</p>. - Same paper, same Markdown source as the PDF, different output.
turnout-paper/data/survey.dta
<stata_dta><header><release>118</release><byteorder>LSF</byteorder><K>��</K><N>,�������</N><label>��</label><timestamp>�03 Oct 2026 15:39</timestamp></header><map>������������������������D�����������������������/���������������C�������f��������#�������#������R%������^%������</map><variable_types>����������</variable_types><varnames>resp_id��������������������������������������������������������������������������������������������������������������������������abbr���������������������������������
00000000: 3c73 7461 7461 5f64 7461 3e3c 6865 6164  <stata_dta><head
00000010: 6572 3e3c 7265 6c65 6173 653e 3131 383c  er><release>118<
00000020: 2f72 656c 6561 7365 3e3c 6279 7465 6f72  /release><byteor
00000030: 6465 723e 4c53 463c 2f62 7974 656f 7264  der>LSF</byteord
00000040: 6572 3e3c 4b3e 0500 3c2f 4b3e 3c4e 3e2c  er><K>..</K><N>,
00000050: 0100 0000 0000 003c 2f4e 3e3c 6c61 6265  .......</N><labe
00000060: 6c3e 0000 3c2f 6c61 6265 6c3e 3c74 696d  l>..</label><tim
00000070: 6573 7461 6d70 3e11 3033 204f 6374 2032  estamp>.03 Oct 2
00000080: 3032 3620 3135 3a33 393c 2f74 696d 6573  026 15:39</times
00000090: 7461 6d70 3e3c 2f68 6561 6465 723e 3c6d  tamp></header><m
- Starts with readable tags:
<stata_dta><header><release>118… - …then numbers stored as raw bytes, not digits, so a text editor shows garbage.
- You need Stata, R's
havenor Python'spandasto read it.
turnout-paper/build/3-paper.pdf
%PDF-1.5
%����
13 0 obj
<<
/Length 1609
/Filter /FlateDecode
>>
stream
xڥWKs�6���W�H�D���sK�j;��Þ��Ɂ�`�S�tIʮ�����ɔ̤�v<c���b��.x��x������W�/�+���Iatvu��cXaLf�a����:�ί�n7���2��5-��E����ۏD�[����Wj��q��D��-����?��~����L�Ǭ��R
V
G�����Xw��X�Z�6V�#�jK'��6[*͜-�ěK������(�[ȏ�����v�X����.W�o�y��q �'n��7�����"�[,�����Q��J��KY2e,]��j�n�X��$��$CriI�[dB3�-�/�`��0�1��G9?��%��
�|���'�UV��J���8���'2��+�˴u���[�A���`�'%^7���!$�e���ò�>}p3�[_�D� L.'!!L�q�IF��]��у�&0�$O�5�>��U?$WT��aA+��(���
%PDF-1.5
%ÐÔÅØ
13 0 obj
<<
/Length 1609
/Filter /FlateDecode
>>
stream
[1,609 bytes of compressed page content]
…
endstream
endobj
startxref
278615
%%EOF
- A list of numbered objects; page content is compressed (
/FlateDecode). startxrefpoints to an exact byte offset, so editing one character by hand breaks the file.- Made for presentation: it stores where each glyph goes, not what is a heading.
turnout-paper/draft-from-advisor.docx
PK���������C]����o���%�������[Content_Types].xml�U�n�0����k�Nz��*$�.�6R��p�@��E����;@��*����$3��?f�l��e����5)�&����6S�H���%�g��lup�"j5!e�D��y���"$ց�Jn��HG_p'�(��N&w\Z�`0ƚ��gO�����yO�[Y������R&�+��He�T�I��2� �&�e/�����������Q⍒�*�h)<�
M||g}�w�~�DJ%$�nOh�<W�2++M��&t�J���t�� �vb*��O����Q�������N�i��}N/����k椰�����������I�b�PoR�YLF�xT��{'.��G��ݫ�����Z}�[�s��Y�C�cLz�;��1\�AW�B�a#��{�(���,�Ecq���Qw.x�ߛ��PK���������C]�w��������������_rels/.rels��MN�1�F��y���
B�i7�Rw���X�g&��Q�B�=�!���]t1829 [Content_Types].xml 722 _rels/.rels 2193 word/document.xml 1203 word/_rels/document.xml.rels 124 word/_rels/footnotes.xml.rels 4119 word/numbering.xml 20527 word/styles.xml 843 word/footnotes.xml 625 word/comments.xml … 7 more ── word/document.xml ── <w:body> <w:bookmarkStart w:id="20" w:name="comments-on-your-draft"/> <w:p> <w:pPr> <w:pStyle w:val="Heading1"/> </w:pPr> <w:r> <w:t xml:space="preserve">Comments on your draft</w:t> </w:r> </w:p> <w:p> <w:pPr> <w:pStyle w:val="FirstParagraph"/> …
- Rename it to
.zipand unzip it: it's a folder of XML files. - Text lives in
<w:t>, styling in<w:pPr>/<w:rPr>, scattered across many tags. - Readable in principle, but not something you edit or diff by hand.
turnout-paper/data/codebook.xlsx
PK���������|C]�\��������������[Content_Types].xml���N�0��_��Z�N; ��t(t�����sI��K>����I��*�0�����dW���v�Hڻ��E��:�[�������-�6��= �luT�!�p'%��-���]V:�-�|����F�Qn��F*���T���7�=vp4�=L����h����8�j�!�� e]�\��R\�"'���:�*���J������S~��[d���#�쒓�o>��ޏ���+[���
[��6G����Ҁ�������[��_�$����E��?���w7�PK���������|C]�I��������������_rels/.rels����� ���W!�;��c��.�dW3��Y���%�:�^��x������U�ؙ=0DCN��(��S����\����M]]p�)'�h|d�⢀1%��<�����yty3P�2�1h��F�+�=����M���B�o�u/���4�F��ݢK?N|%�,��$`����t#�����+�z�~�PK��
    540  [Content_Types].xml
    278  _rels/.rels
    268  xl/workbook.xml
    279  xl/_rels/workbook.xml.rels
   1742  xl/worksheets/sheet1.xml

── xl/worksheets/sheet1.xml ──
  <sheetData>
    <row r="1">
      <c r="A1" t="inlineStr">
        <is>
          <t>file</t>
        </is>
      </c>
      <c r="B1" t="inlineStr">
        <is>
          <t>variable</t>
        </is>
      </c>
      <c r="C1" t="inlineStr">
  …
- Also a ZIP of XML: one file per worksheet.
- Each cell is a
<c r="A1">tag; formatting and formulas live alongside. - Export to
.csvwhen you want the data itself.
turnout-paper/talk.pptx
PK���������C]2���������������ppt/slides/slide1.xml�T]��!��+�����M�fs���Ik���I�);��,�@]�}�vQ��Ĥ}���93����Ե��胲f������H[+���/�ww/����UA�@�&Tbʚ�]�y���"�[��|��[�i鷼��@�����9o�2l������FI|c�E�{��ZDj34ʅ��nAs�����_ZJ��Jי�[{�d��{�Vn�{�_zP5���������<C\�6���!l�)�n��4�=覌�>摧M�"�~W^l���hټ���K�~Q8��;��դ�Z������J��ͭ���X"�e�I�Bz�iv�ģ#����I�����I�ؽ��1��Ns�+*��*����ry ���LT���3����dd�����d����gk����ajXQ���cN�}b��ŋx���Y��5��������k�0�WAU�]���-�5����ɣ������X��Q��W�ח#X|���o#���iuE�[K��1269 ppt/slides/slide1.xml 1220 ppt/slides/slide2.xml 293 ppt/slides/_rels/slide1.xml.rels 293 ppt/slides/_rels/slide2.xml.rels 12012 ppt/slideMasters/slideMaster1.xml 1984 ppt/slideMasters/_rels/slideMaster1.xml.rels 3465 [Content_Types].xml 583 docProps/core.xml 212 docProps/custom.xml … 31 more ── ppt/slides/slide1.xml ── <a:pPr lvl="0" indent="0" marL="0"> <a:buNone/> </a:pPr> <a:r> <a:rPr/> <a:t>Timing and Turnout</a:t> </a:r> </a:p> </p:txBody> </p:sp> <p:sp> <p:nvSpPr> <p:cNvPr id="3" name="Content Placeholder 2"/> <p:cNvSpPr> <a:spLocks noGrp="1"/> </p:cNvSpPr> …
- A ZIP of XML: one file per slide, plus masters, themes and layouts.
- The words on the slide are buried deep inside shape and text-box tags.
Markdown → LaTeX → PDF
---
title: "Timing and Turnout in Off-Cycle Governor Elections"
author: "CS 101 for Political Scientists"
---

# Introduction

Five American states elect their governors in
odd-numbered years. We ask whether this *timing*
changes **who shows up**.

Off-cycle elections lower turnout [@anzia2011election].

- `turnout.csv`: state-level governor elections
- `survey.dta`: a Stata survey
\title{Timing and Turnout in Off-Cycle
Governor Elections}
\author{CS 101 for Political Scientists}
\date{}

\begin{document}
\maketitle

\hypertarget{introduction}{%
\section{Introduction}\label{introduction}}

Five American states elect their governors
in odd-numbered years. We ask whether this
\emph{timing} changes \textbf{who shows up}.

Off-cycle elections lower turnout
\citep{anzia2011election}.

\begin{itemize}
\tightlist
\item
  \texttt{turnout.csv}: state-level governor
  elections
\item
  \texttt{survey.dta}: a Stata survey
\end{itemize}

  \bibliography{references.bib}

\end{document}
+ bibtex→
R Markdown → Markdown → LaTeX → PDF
---
title: "Timing and Turnout"
output: pdf_document
---

```{r setup, include=FALSE}
source("analysis/clean.R")
```

# Data

- `turnout.csv`: `r nrow(turnout)` elections
- `survey.dta`: `r nrow(survey)` respondents

# Results

Off-cycle turnout is
**`r sprintf("%.1f", turnout_gap)` points lower**.

```{r turnout-table, echo=FALSE}
knitr::kable(by_timing, digits = 1,
             format = "latex", booktabs = TRUE)
```
---
title: "Timing and Turnout"
output: pdf_document
---

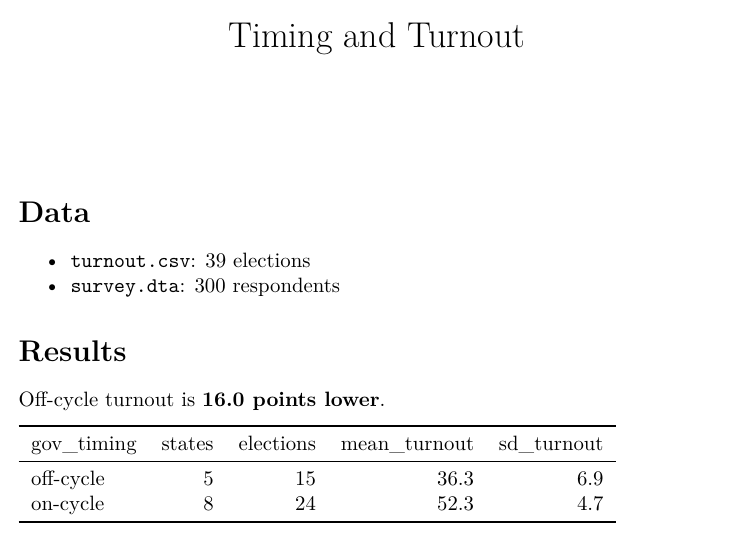
# Data

- `turnout.csv`: 39 elections
- `survey.dta`: 300 respondents

# Results

Off-cycle turnout is
**16.0 points lower**.

\begin{tabular}{lrrrr}
\toprule
gov\_timing & states & elections & mean\_turnout & sd\_turnout\\
\midrule
off-cycle & 5 & 15 & 36.3 & 6.9\\
on-cycle & 8 & 24 & 52.3 & 4.7\\
\bottomrule
\end{tabular}
\title{Timing and Turnout}
\author{}
\date{}

\begin{document}
\maketitle

\hypertarget{data}{%
\section{Data}\label{data}}

\begin{itemize}
\tightlist
\item
  \texttt{turnout.csv}: 39 elections
\item
  \texttt{survey.dta}: 300 respondents
\end{itemize}

\hypertarget{results}{%
\section{Results}\label{results}}

Off-cycle turnout is \textbf{16.0 points
lower}.

\begin{tabular}{lrrrr}
\toprule
gov\_timing & states & elections & mean\_turnout & sd\_turnout\\
\midrule
off-cycle & 5 & 15 & 36.3 & 6.9\\
on-cycle & 8 & 24 & 52.3 & 4.7\\
\bottomrule
\end{tabular}

\end{document}
Part 2
Collaboration & Long-Term Projects
PaperFinalFinalFinal3.docx
Git commands
Start
Record
Share
Branch
- Turns the current folder into a Git repository by creating a hidden
.git/folder; the history will live there. - Nothing is saved yet. Run it once per project.
- Files matching
.gitignore(herebuild/, PDFs, caches) are never tracked: they can be regenerated.
$ git init -b main
Initialized empty Git repository in ~/cs101-demo/alice/turnout-paper/.git/
- Downloads every file and every past version, and remembers where it came from (
origin). - This is how a coauthor joins: no emailing zip files.
$ git clone https://github.com/alice/turnout-paper.git
Cloning into 'turnout-paper'...
done.
- Every commit is stamped with a name and email, so the history shows who changed what.
--globalsets it for all your projects; without it, just this one.
$ git config user.name "Bob"
$ git config user.email "[email protected]"
- Lists what changed since the last commit, and what is staged for the next one.
- When in doubt, run
git status: it usually tells you the next command too.
$ git status
On branch main

No commits yet

Untracked files:
  (use "git add <file>..." to include in what will be committed)
	.gitignore
	analysis/
	data/
	draft-from-advisor.docx
	notes.txt
	paper.rmd
	references.bib
	render.sh
	talk.pptx

nothing added to commit but untracked files present (use "git add" to track)
- Shows changes line by line: - removed, + added.
- Works on any text file, including
.csvdata. For binary files it can only say Binary files differ.
$ git diff
diff --git a/paper.rmd b/paper.rmd
index 34bcb22..b74e67c 100644
--- a/paper.rmd
+++ b/paper.rmd
@@ -1,5 +1,5 @@
 ---
-title: "Timing and Turnout in Off-Cycle Governor Elections"
+title: "Timing and Turnout: Evidence from Off-Cycle Governor Elections"
 author: "CS 101 for Political Scientists (demo paper)"
 date: "October 6, 2026"
 bibliography: references.bib
$ git diff
diff --git a/data/turnout.csv b/data/turnout.csv
index 774a184..ed24559 100644
--- a/data/turnout.csv
+++ b/data/turnout.csv
@@ -38,3 +38,5 @@
 "NV",2014,52.8
 "NV",2018,52.6
 "NV",2022,56.5
+"VA",2025,41.2
+"NJ",2025,39.0
- Moves changes to the staging area: a draft of the next commit.
git add .stages everything;git add paper.rmdjust one file.
$ git add .
$ git status
On branch main

No commits yet

Changes to be committed:
  (use "git rm --cached <file>..." to unstage)
	new file:   .gitignore
	new file:   analysis/clean.R
…
- Records the staged changes as a new version, with a message saying why.
- Each commit gets an ID like
7c6b9b2; you can always go back to it. git commit -am "…"stages and commits changed files in one go.
$ git commit -am "Sharpen the title"
[main 20367f1] Sharpen the title
 1 file changed, 1 insertion(+), 1 deletion(-)
- Lists commits, newest first.
--graphdraws where lines of work split and joined.
$ git log --oneline --graph
* e3c2e8d Try numbered citations
*   aee74f0 Merge branch 'main' of https://github.com/alice/turnout-paper
|\
| * cf06f89 Reword opening sentence
* | 06e7ad8 Use 'gubernatorial' in the opening
|/
*   120826e Merge branch 'main' of https://github.com/alice/turnout-paper
|\
| * 20367f1 Sharpen the title
* | cedb6fe Add 2025 races
|/
* 7c6b9b2 First draft of the turnout paper
- Puts a file back the way it was in the last commit.
- Careful: uncommitted changes are gone for good. Committed work is always safe.
$ echo "% scratch" >> notes.txt
$ git restore notes.txt
- Sends your new commits to GitHub so coauthors can get them.
- Rejected if someone pushed first:
git pull, then push again. - The very first time:
git remote add origin <url>(orgh repo create).
$ git push -u origin main
To https://github.com/alice/turnout-paper.git
 * [new branch]      main -> main
branch 'main' set up to track 'origin/main'.
$ git push
To https://github.com/alice/turnout-paper.git
 ! [rejected]        main -> main (fetch first)
…
- Downloads new commits and merges them into yours.
- Different parts changed: merged automatically. Same lines changed: a conflict you resolve by hand, then
git add+git commit.
$ git pull --no-edit
From https://github.com/alice/turnout-paper
   7c6b9b2..20367f1  main       -> origin/main
Merge made by the 'ort' strategy.
 paper.rmd | 2 +-
 1 file changed, 1 insertion(+), 1 deletion(-)

$ git pull --no-edit
From https://github.com/alice/turnout-paper
   120826e..cf06f89  main       -> origin/main
Auto-merging paper.rmd
CONFLICT (content): Merge conflict in paper.rmd
Automatic merge failed; fix conflicts and then commit the result.
<<<<<<< HEAD
Five U.S. states hold gubernatorial elections in odd-numbered years, away from federal election…
=======
Five American states elect their governors in odd years, when no federal races are on the ballo…
>>>>>>> cf06f89d65a296548c70c1e5f0325ae413cd94f3
git switch -c namestarts a branch: an experiment that doesn't touchmain.git switch maingoes back; your folder changes to match.- The Git answer to
PaperFinalCopy2.docx.
$ git switch -c numbered-citations
Switched to a new branch 'numbered-citations'
$ git switch main
Switched to branch 'main'
Your branch is up to date with 'origin/main'.
- Brings another branch's commits into the current one.
- If
mainhasn't moved, Git just moves it forward (fast-forward); otherwise it makes a merge commit. git pullisgit fetch+git merge.
$ git merge numbered-citations
Updating aee74f0..e3c2e8d
Fast-forward
 paper.rmd | 1 +
 1 file changed, 1 insertion(+)
One paper, two coauthors, one history
Part 3
AI in Your Research
Pitfalls and leverage points
Thank you
Questions?